排查 rum collect 服务内存泄露
自接手 rum collect 服务以来,我们已做过数轮优化,包括性能、高可用等,取得了不少的成就,比如启动耗时从 60 秒降低到 3 秒。但仍然有个棘手的内存泄露问题尚未解决,几经接手交接到我这,由于工具使用错误导致一直没能发现问题,遂记录本文以作自省。
环境与现象
rum collect 服务是部署于 TKEX-CSIG 集群上的上报接收服务,负责接收海量 SDK 上报的数据,并经过处理后发送到不同平台。该服务依赖于 redis 获取项目信息和限流、白名单等,之后对接智研、TCCM 等平台。
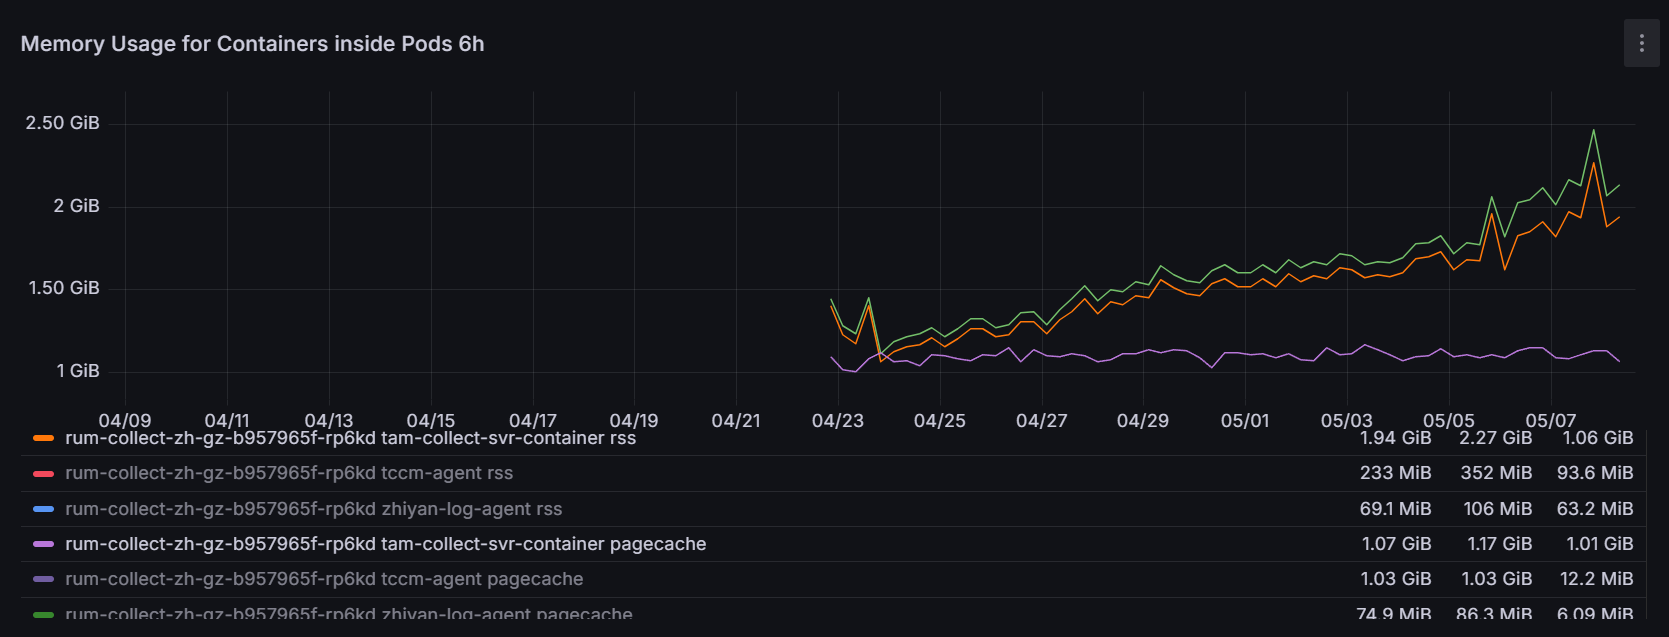
TKEX-CSIG 自带 node-exporter 监控,从 container 监控中可以看到内存在缓慢地泄露,速度约为 0.5G/天。
初次尝试
根据历史经验,10 次内存泄露 8 次是 goroutine 泄露,还有 1 次 CGO,最多 1 次是真的泄露。开启 collect 服务的 pprof router,用如下命令抓取 profile:
curl http://localhost:6060/debug/pprof/heap\?seconds\=120 --output heap.profcurl http://localhost:6060/debug/pprof/profile\?seconds\=120 --output profile.profcurl 'http://localhost:6060/debug/pprof/goroutine?seconds=120' --output goroutine.prof
2025-04-28 抓取了可是结果显示没啥明显异常:
❯ go tool pprof  '2025-04-28 heap.prof'
File: collect_svr
Type: inuse_space
Time: 2025-04-28 15:19:25 CST
Duration: 120.43s, Total samples = 185.07MB
Entering interactive mode (type "help" for commands, "o" for options)
(pprof) top
Showing nodes accounting for 68.29MB, 36.90% of 185.07MB total
Dropped 45 nodes (cum <= 0.93MB)
Showing top 10 nodes out of 207
      flat  flat%   sum%        cum   cum%
   42.01MB 22.70% 22.70%    42.01MB 22.70%  internal/profile.(*Profile).postDecode
       6MB  3.24% 25.94%    10.50MB  5.67%  internal/profile.glob..func2
    5.21MB  2.81% 28.76%     5.21MB  2.81%  bytes.makeSlice
       5MB  2.70% 31.46%        5MB  2.70%  git.code.oa.com/TAM/tam_collect_svr/internal/data.(*projectRepo).sync
    3.50MB  1.89% 33.35%     3.50MB  1.89%  fmt.Sprintf
    2.50MB  1.35% 34.70%     4.50MB  2.43%  git.code.oa.com/TAM/tam_collect_svr/internal/biz/domain.(*metricsCommon).GetMetricsLabels
    2.50MB  1.35% 36.05%     2.50MB  1.35%  internal/profile.decodeInt64s
      -2MB  1.08% 34.97%       -2MB  1.08%  net/textproto.(*Reader).ReadMIMEHeader
       2MB  1.08% 36.05%        2MB  1.08%  internal/profile.glob..func19
    1.57MB  0.85% 36.90%     1.57MB  0.85%  git.code.oa.com/cm-metrics/sdk_metric_pb.(*MetricList).Marshal
❯ go tool pprof  '2025-04-28 goroutine.prof'
File: collect_svr
Type: goroutine
Time: 2025-04-28 15:43:35 CST
Duration: 120.04s, Total samples = 29
Entering interactive mode (type "help" for commands, "o" for options)
(pprof) top
Showing nodes accounting for 8, 27.59% of 29 total
Showing top 10 nodes out of 105
      flat  flat%   sum%        cum   cum%
         8 27.59% 27.59%          8 27.59%  runtime.gopark
         1  3.45% 31.03%          1  3.45%  git.code.oa.com/TAM/tam_collect_svr/internal/data.IsTsmFields
        -1  3.45% 27.59%         -1  3.45%  reflect.Value.Convert
         1  3.45% 31.03%          1  3.45%  runtime.growWork_faststr
        -1  3.45% 27.59%         -1  3.45%  runtime.mapaccess1_faststr
         1  3.45% 31.03%          1  3.45%  runtime.newobject
        -1  3.45% 27.59%         -1  3.45%  runtime.slicebytetostring
         1  3.45% 31.03%          1  3.45%  sort.insertionSort
        -1  3.45% 27.59%         -1  3.45%  syscall.Syscall6
         0     0% 27.59%         -2  6.90%  bufio.(*Reader).Peek
看来问题隐藏很深,等个一周,2025-05-08 再抓再对比分析!
❯ go tool pprof  '2025-05-08 heap.prof'
File: collect_svr
Type: inuse_space
Time: 2025-05-08 15:49:40 CST
Duration: 120.54s, Total samples = 253.20MB
Entering interactive mode (type "help" for commands, "o" for options)
(pprof) top
Showing nodes accounting for 79.72MB, 31.48% of 253.20MB total
Dropped 21 nodes (cum <= 1.27MB)
Showing top 10 nodes out of 232
      flat  flat%   sum%        cum   cum%
   53.01MB 20.94% 20.94%    53.01MB 20.94%  internal/profile.(*Profile).postDecode
   10.91MB  4.31% 25.25%    13.41MB  5.30%  internal/profile.glob..func2
    5.48MB  2.16% 27.41%     5.48MB  2.16%  bytes.makeSlice
       4MB  1.58% 28.99%        4MB  1.58%  git.code.oa.com/TAM/tam_collect_svr/internal/data.(*metricsTCCMExporter).getTagsFromSampleLabel
    3.88MB  1.53% 30.53%     3.88MB  1.53%  runtime/pprof.(*profMap).lookup
    3.50MB  1.38% 31.91%     3.50MB  1.38%  strconv.appendQuotedWith
      -3MB  1.18% 30.72%    -1.50MB  0.59%  git.code.oa.com/cm-metrics/tccm-client-go/internal/metric.(*CustomMetric).AddTags
   -2.51MB  0.99% 29.73%       -1MB  0.39%  git.code.oa.com/TAM/tam_collect_svr/internal/biz/domain.(*LogMessage).GetRecordFieldMaps
    2.50MB  0.99% 30.72%        6MB  2.37%  fmt.Sprintf
    1.93MB  0.76% 31.48%     1.93MB  0.76%  google.golang.org/protobuf/internal/encoding/json.(*Decoder).parseString
❯ go tool pprof  '2025-05-08 goroutine.prof'
File: collect_svr
Type: goroutine
Time: 2025-05-08 15:49:55 CST
Duration: 120.08s, Total samples = 28
Entering interactive mode (type "help" for commands, "o" for options)
(pprof) top
Showing nodes accounting for -4, 14.29% of 28 total
Showing top 10 nodes out of 87
      flat  flat%   sum%        cum   cum%
        -3 10.71% 10.71%         -3 10.71%  git.code.oa.com/cm-metrics/sdk_metric_pb.(*Metric).Size
        -1  3.57% 14.29%         -1  3.57%  git.code.oa.com/cm-metrics/sdk_metric_pb.(*Tag).MarshalToSizedBuffer
         1  3.57% 10.71%          1  3.57%  github.com/stretchr/stew/slice.Contains
        -1  3.57% 14.29%         -1  3.57%  regexp.(*machine).add
         1  3.57% 10.71%          1  3.57%  runtime.mapaccess1_faststr
        -1  3.57% 14.29%         -1  3.57%  runtime.newobject
         0     0% 14.29%         -1  3.57%  bufio.(*Reader).Peek
         0     0% 14.29%         -1  3.57%  bufio.(*Reader).ReadLine
         0     0% 14.29%         -1  3.57%  bufio.(*Reader).ReadSlice
         0     0% 14.29%         -2  7.14%  bufio.(*Reader).fill
嘶,看不出来明显的“持续存在并增长的” isuse space 啊,协程也没明显增长。
加上对比分析试试:
❯ go tool pprof --base '2025-04-28 heap.prof' '2025-05-08 heap.prof'
File: collect_svr
Type: inuse_space
Time: 2025-04-28 15:19:25 CST
Duration: 240.97s, Total samples = 318.43MB
Entering interactive mode (type "help" for commands, "o" for options)
(pprof) top
Showing nodes accounting for 14.29MB, 4.49% of 318.43MB total
Dropped 46 nodes (cum <= 1.59MB)
Showing top 10 nodes out of 260
      flat  flat%   sum%        cum   cum%
      11MB  3.46%  3.46%       11MB  3.46%  internal/profile.(*Profile).postDecode
      -5MB  1.57%  1.88%       -5MB  1.57%  git.code.oa.com/TAM/tam_collect_svr/internal/data.(*projectRepo).sync
    4.91MB  1.54%  3.43%     2.91MB  0.91%  internal/profile.glob..func2
   -4.01MB  1.26%  2.17%    -3.51MB  1.10%  git.code.oa.com/TAM/tam_collect_svr/internal/biz/domain.(*LogMessage).GetRecordFieldMaps
    3.88MB  1.22%  3.39%     3.88MB  1.22%  runtime/pprof.(*profMap).lookup
   -3.50MB  1.10%  2.29%     0.50MB  0.16%  git.code.oa.com/cm-metrics/tccm-client-go/internal/metric.(*CustomMetric).AddTags
    3.50MB  1.10%  3.39%     3.50MB  1.10%  strconv.appendQuotedWith
    3.13MB  0.98%  4.37%     3.13MB  0.98%  google.golang.org/protobuf/internal/encoding/json.(*Decoder).parseString
       3MB  0.94%  5.31%        3MB  0.94%  git.code.oa.com/TAM/tam_collect_svr/internal/data.(*metricsTCCMExporter).getTagsFromSampleLabel
   -2.63MB  0.83%  4.49%    -2.63MB  0.83%  git.code.oa.com/cm-metrics/sdk_metric_pb.(*MetricList).Marshal
❯ go tool pprof --base '2025-04-28 goroutine.prof' '2025-05-08 goroutine.prof'
File: collect_svr
Type: goroutine
Time: 2025-04-28 15:43:35 CST
Duration: 240.12s, Total samples = 41
Entering interactive mode (type "help" for commands, "o" for options)
(pprof) top
Showing nodes accounting for -13, 31.71% of 41 total
Showing top 10 nodes out of 129
      flat  flat%   sum%        cum   cum%
        -8 19.51% 19.51%         -8 19.51%  runtime.gopark
        -3  7.32% 26.83%         -3  7.32%  git.code.oa.com/cm-metrics/sdk_metric_pb.(*Metric).Size
         2  4.88% 21.95%          2  4.88%  runtime.mapaccess1_faststr
        -2  4.88% 26.83%         -2  4.88%  runtime.newobject
        -1  2.44% 29.27%         -1  2.44%  git.code.oa.com/TAM/tam_collect_svr/internal/data.IsTsmFields
        -1  2.44% 31.71%         -1  2.44%  git.code.oa.com/cm-metrics/sdk_metric_pb.(*Tag).MarshalToSizedBuffer
         1  2.44% 29.27%          1  2.44%  github.com/stretchr/stew/slice.Contains
         1  2.44% 26.83%          1  2.44%  reflect.Value.Convert
        -1  2.44% 29.27%         -1  2.44%  regexp.(*machine).add
        -1  2.44% 31.71%         -1  2.44%  runtime.growWork_faststr
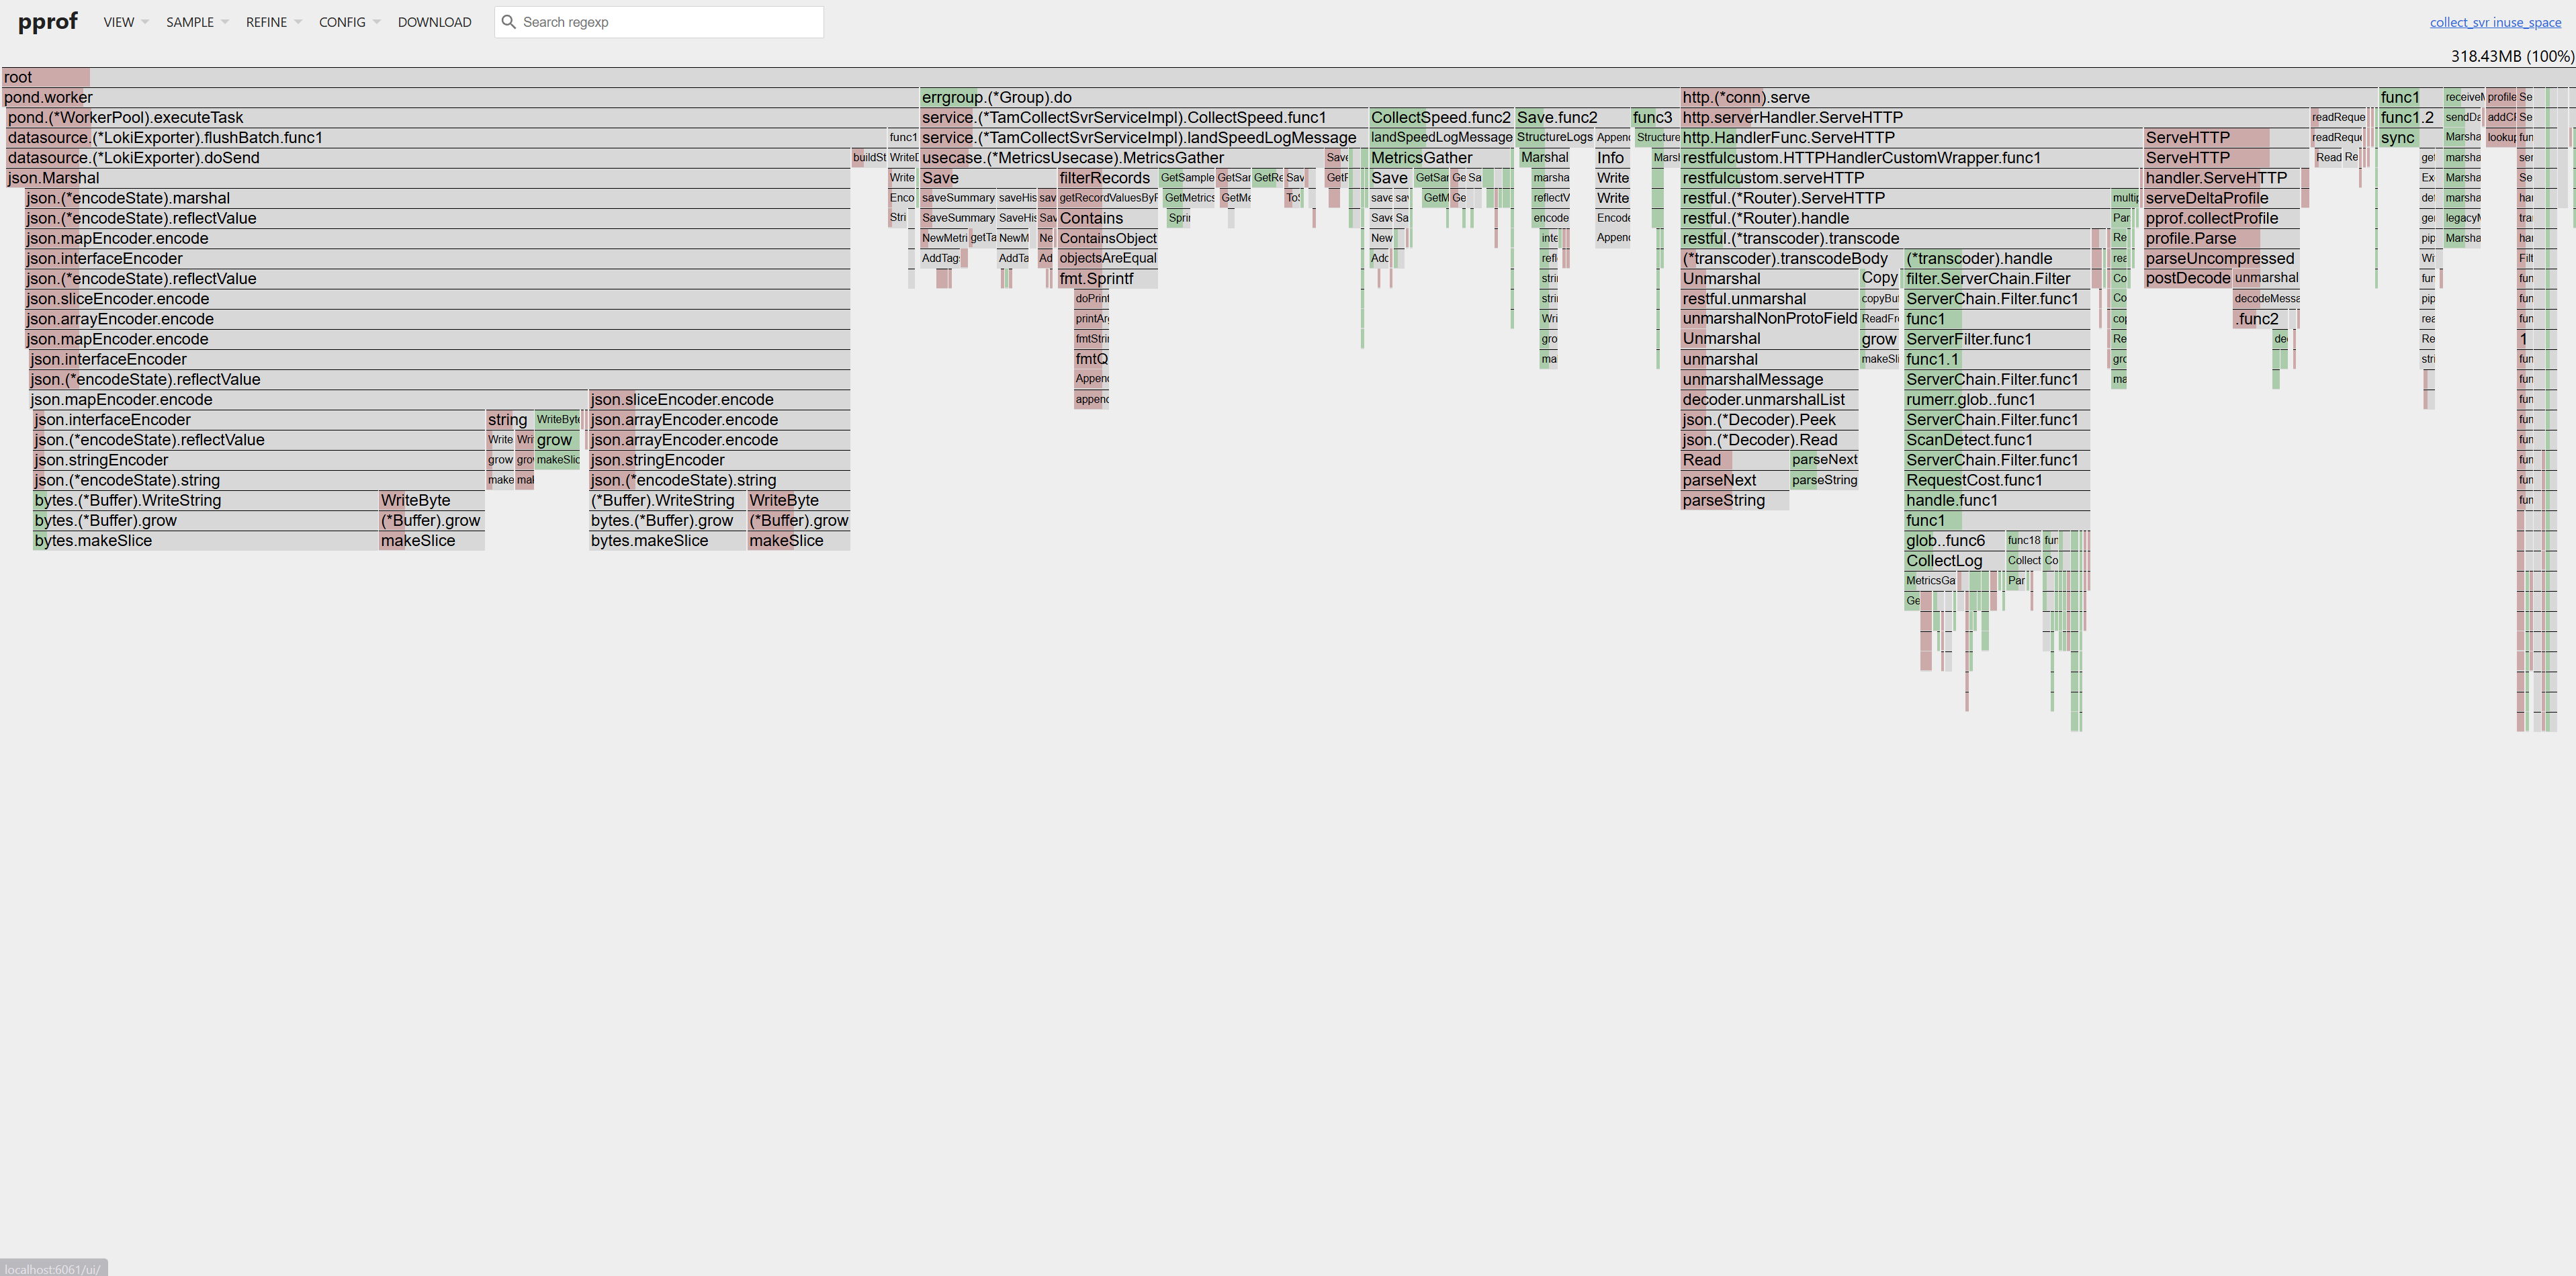
还是没能看出异常,这里加上 heap isuse space 的 flamegraph 图:
以及 goroutine 的 graph 图:
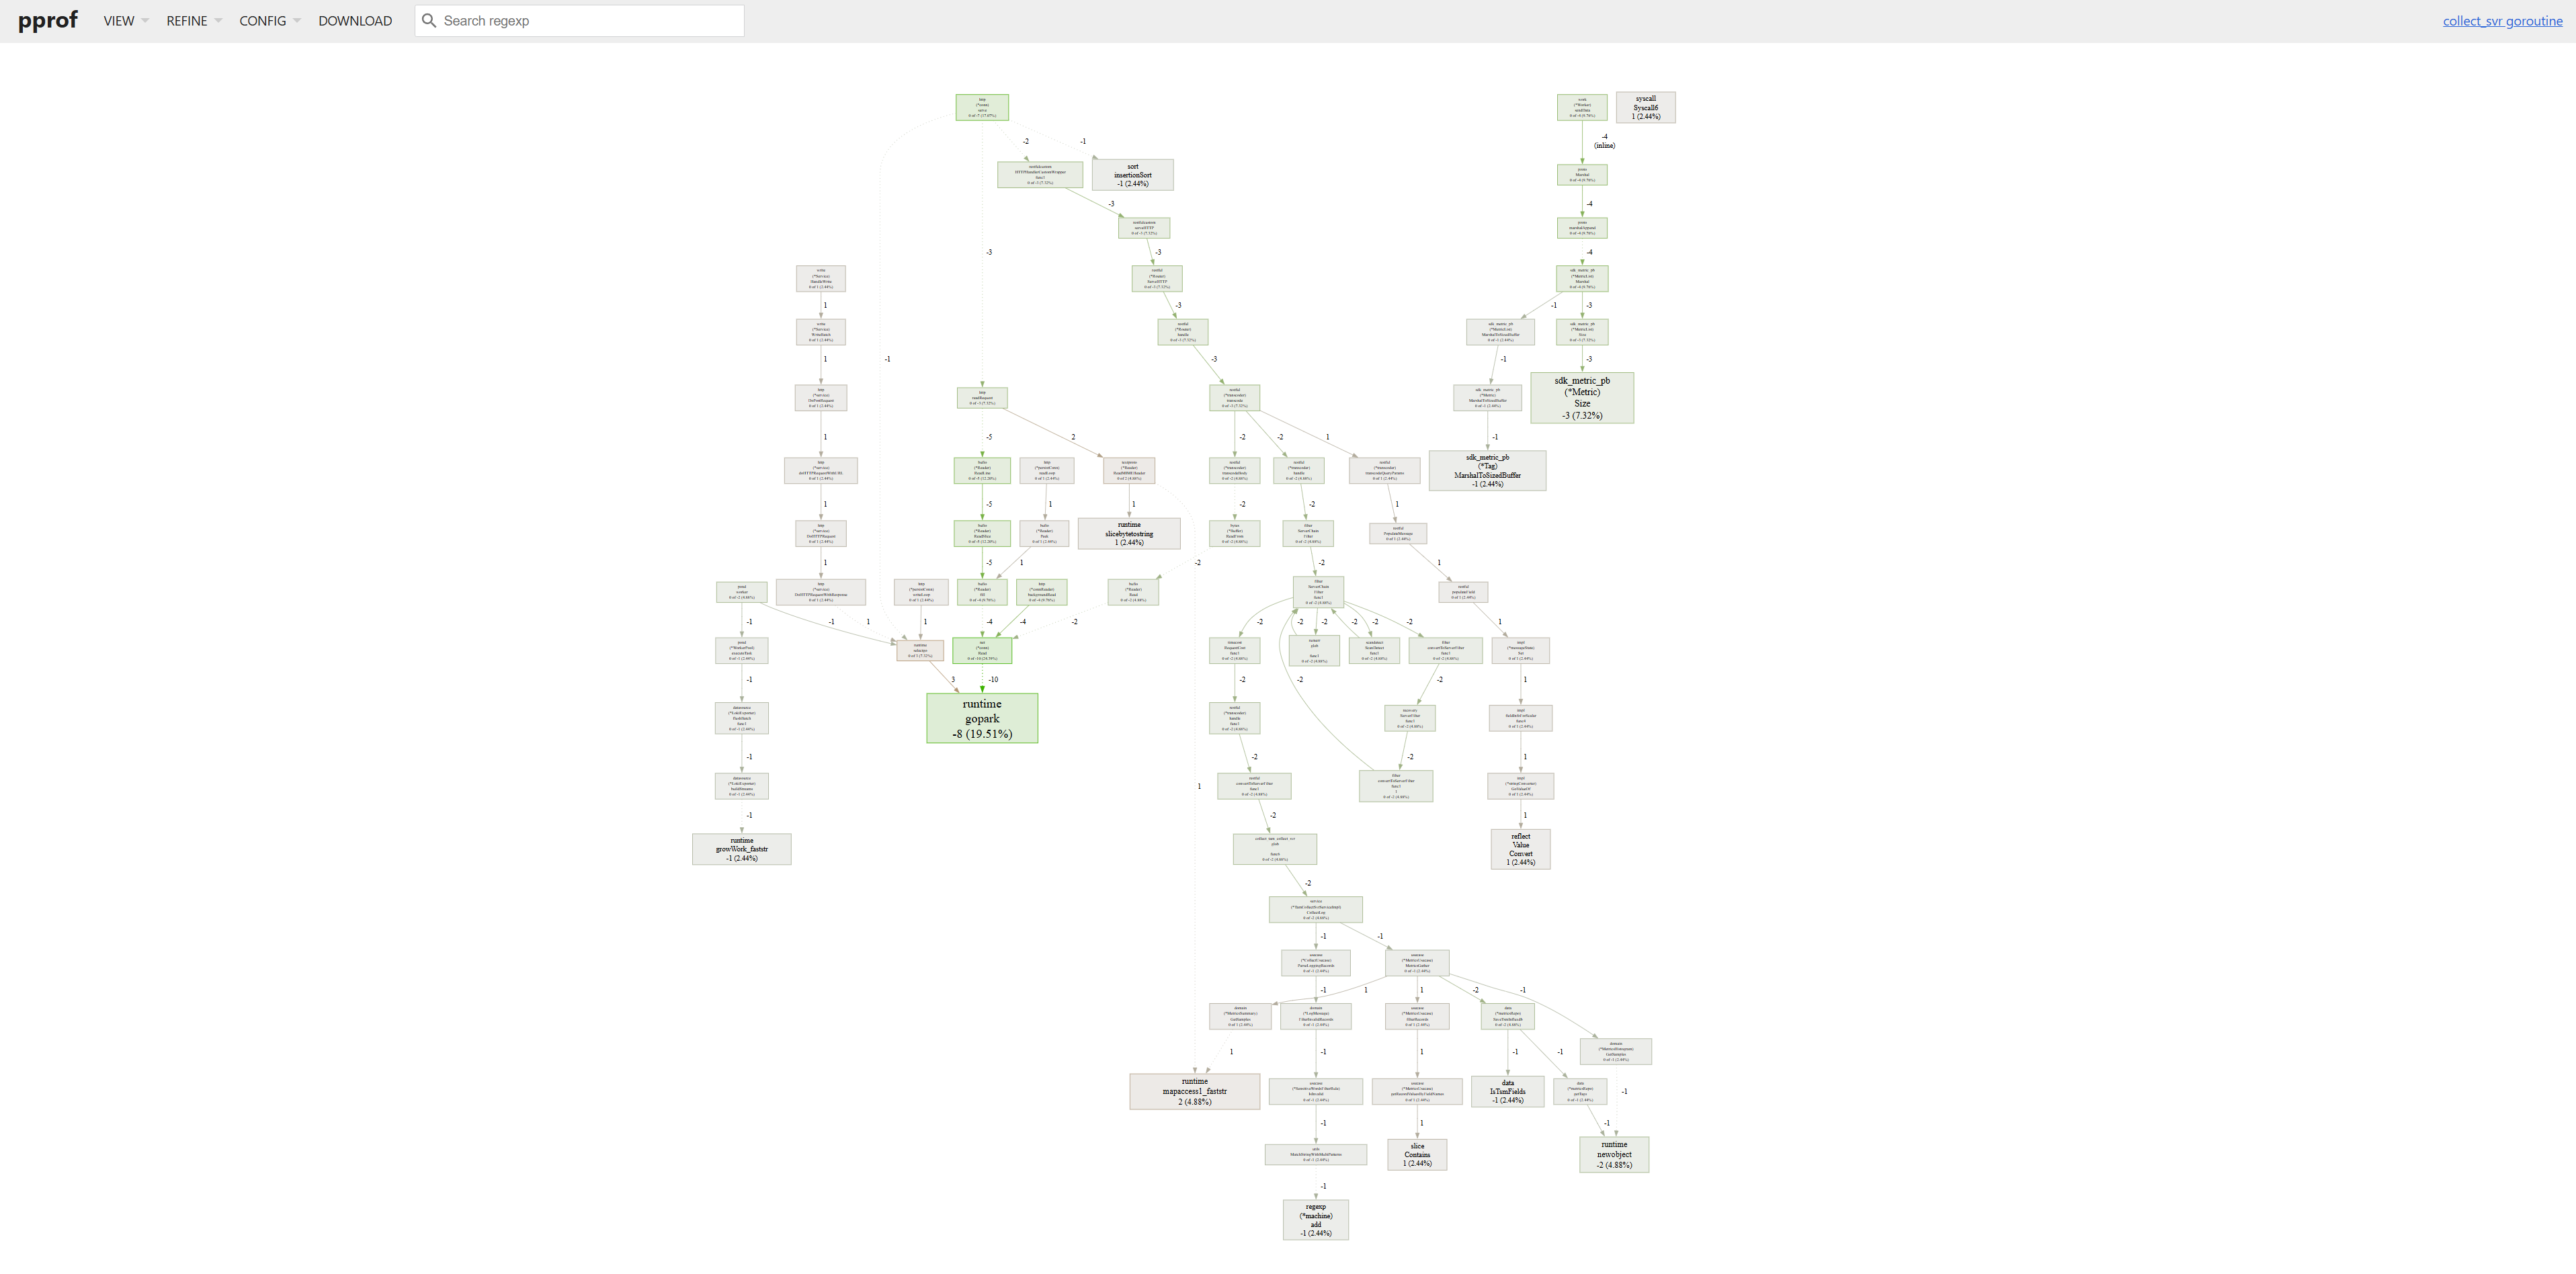
同样没能看出明显异常。
我开始怀疑是不是工具问题,用 flamegraph.com 工具更直观寻找内存增长原因:
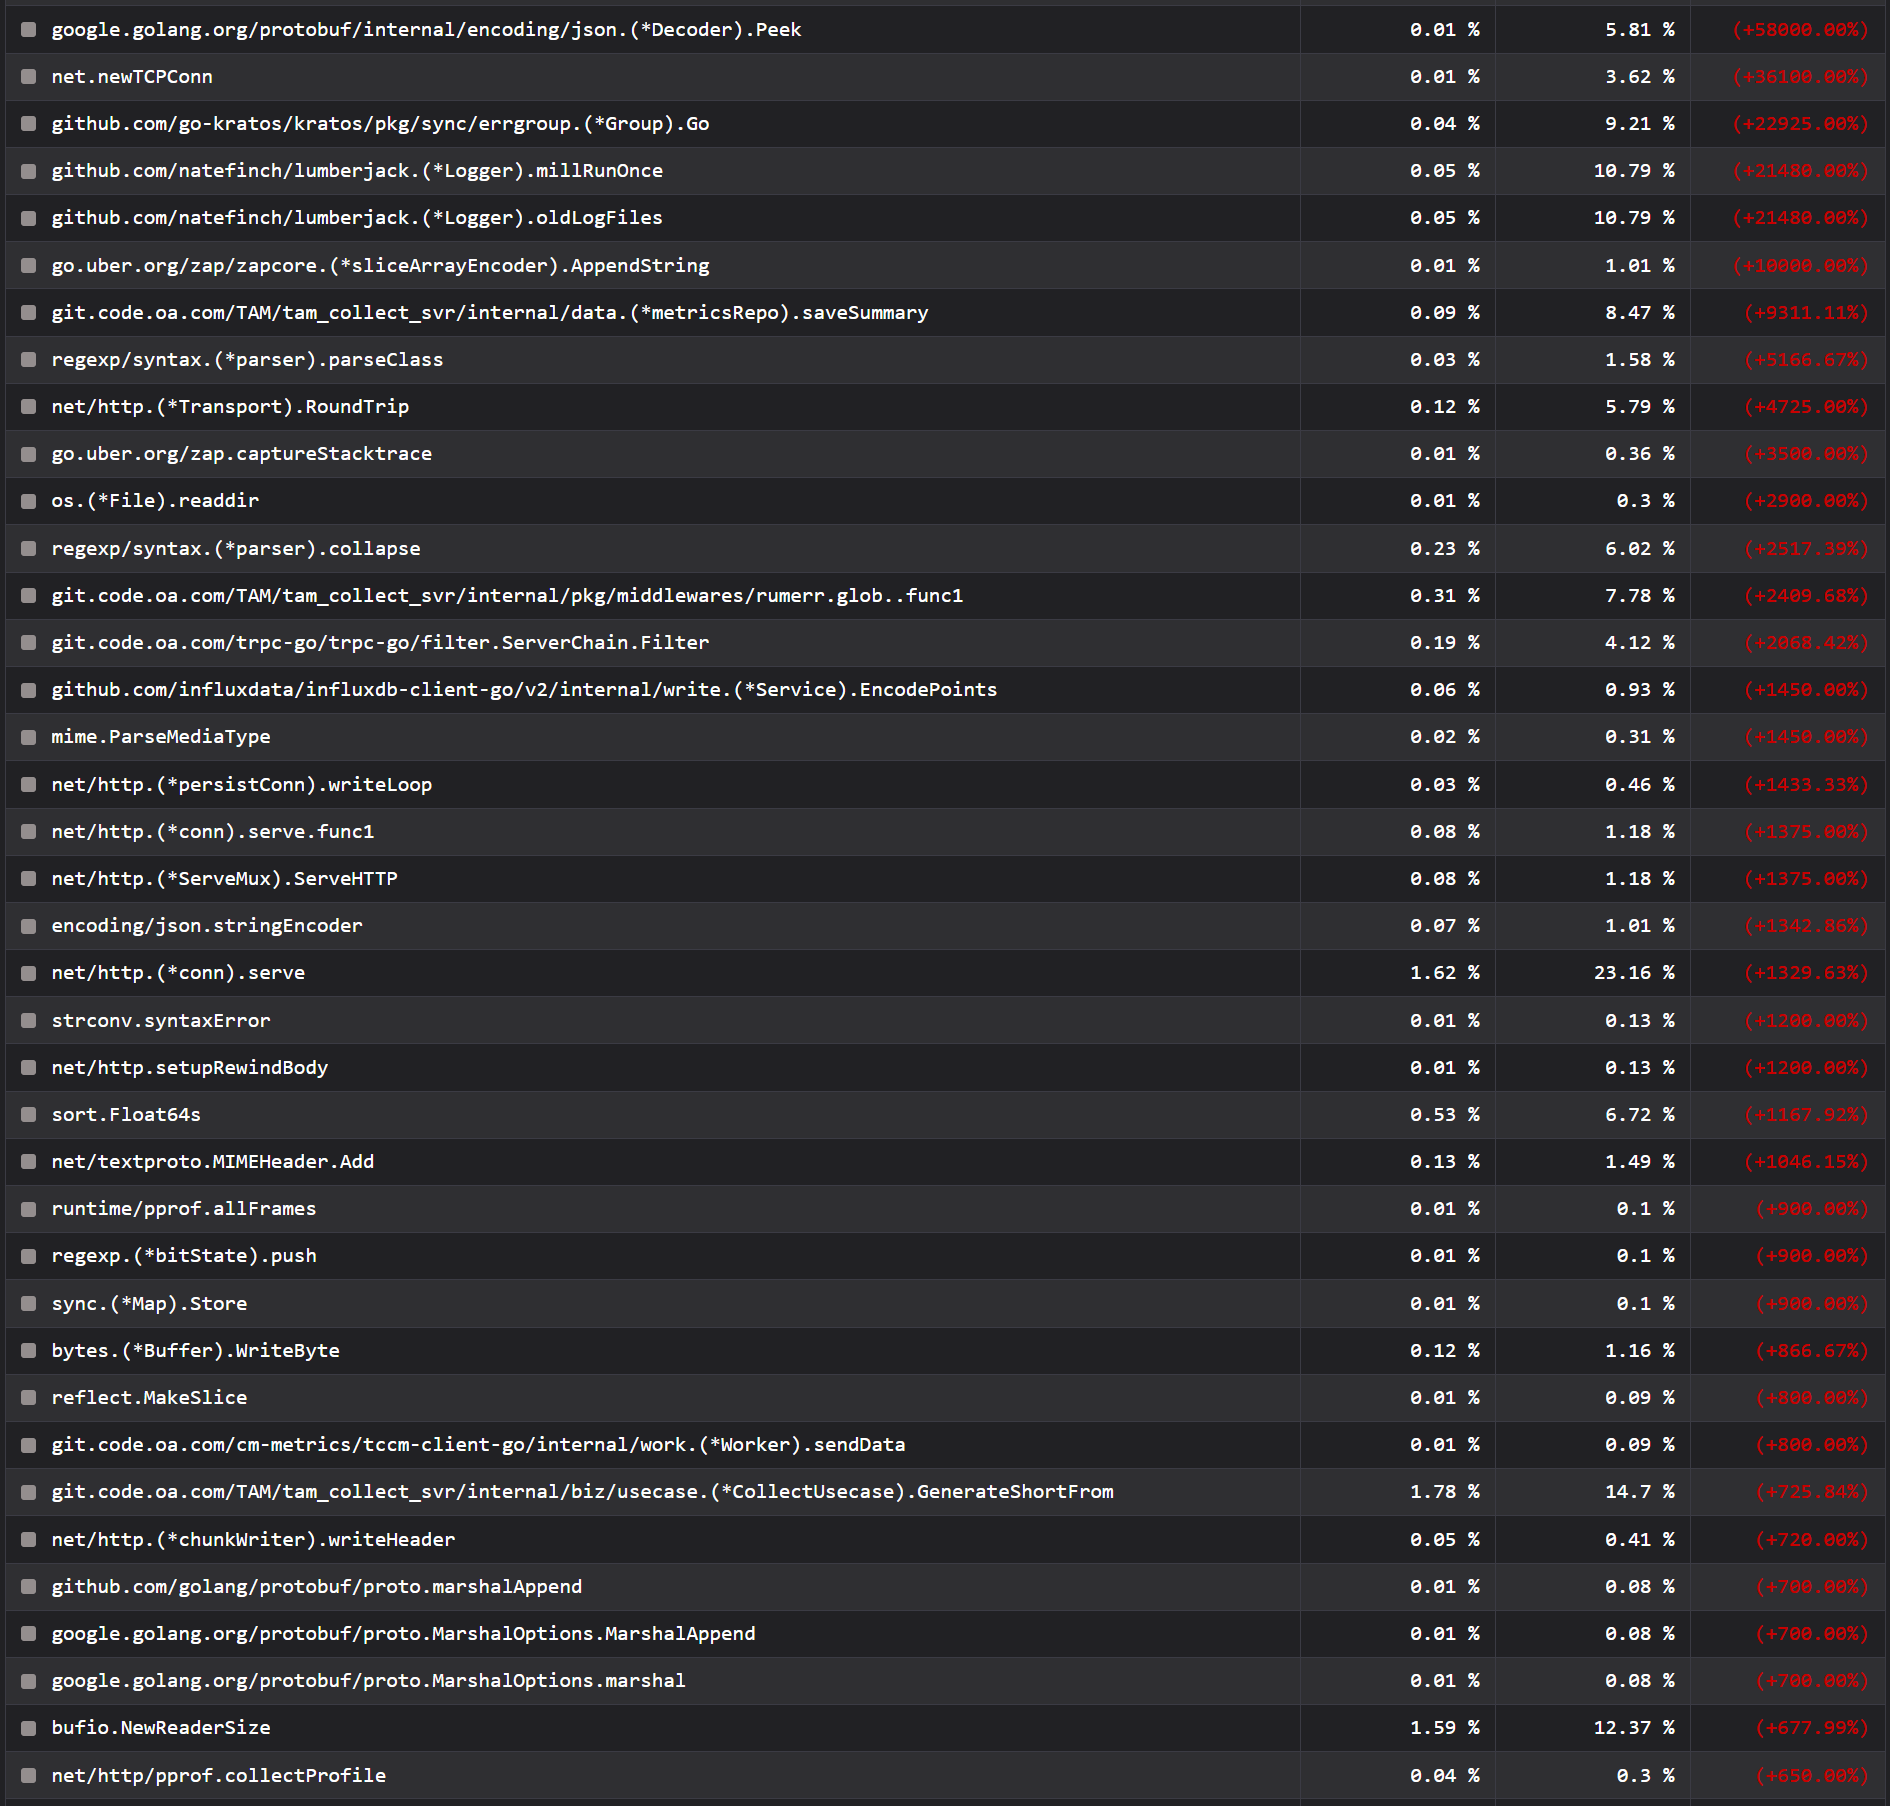
逐个分析内存增长迅猛的可疑点,可以看到它们要么是日志的、要么是 json 的,甚至是 net/http 相关的,这些都是和抓取时请求量相关的指标,并不能说明什么。
可以从 这个链接 查看对比。
至此,分析陷入瓶颈。
引入 trace 监控
同样的方式抓取 trace 监控:
curl -o trace.prof 'http://localhost:6060/debug/pprof/trace?seconds=8'
然后使用第三方 trace ui 工具 gotraceui 对比分析:
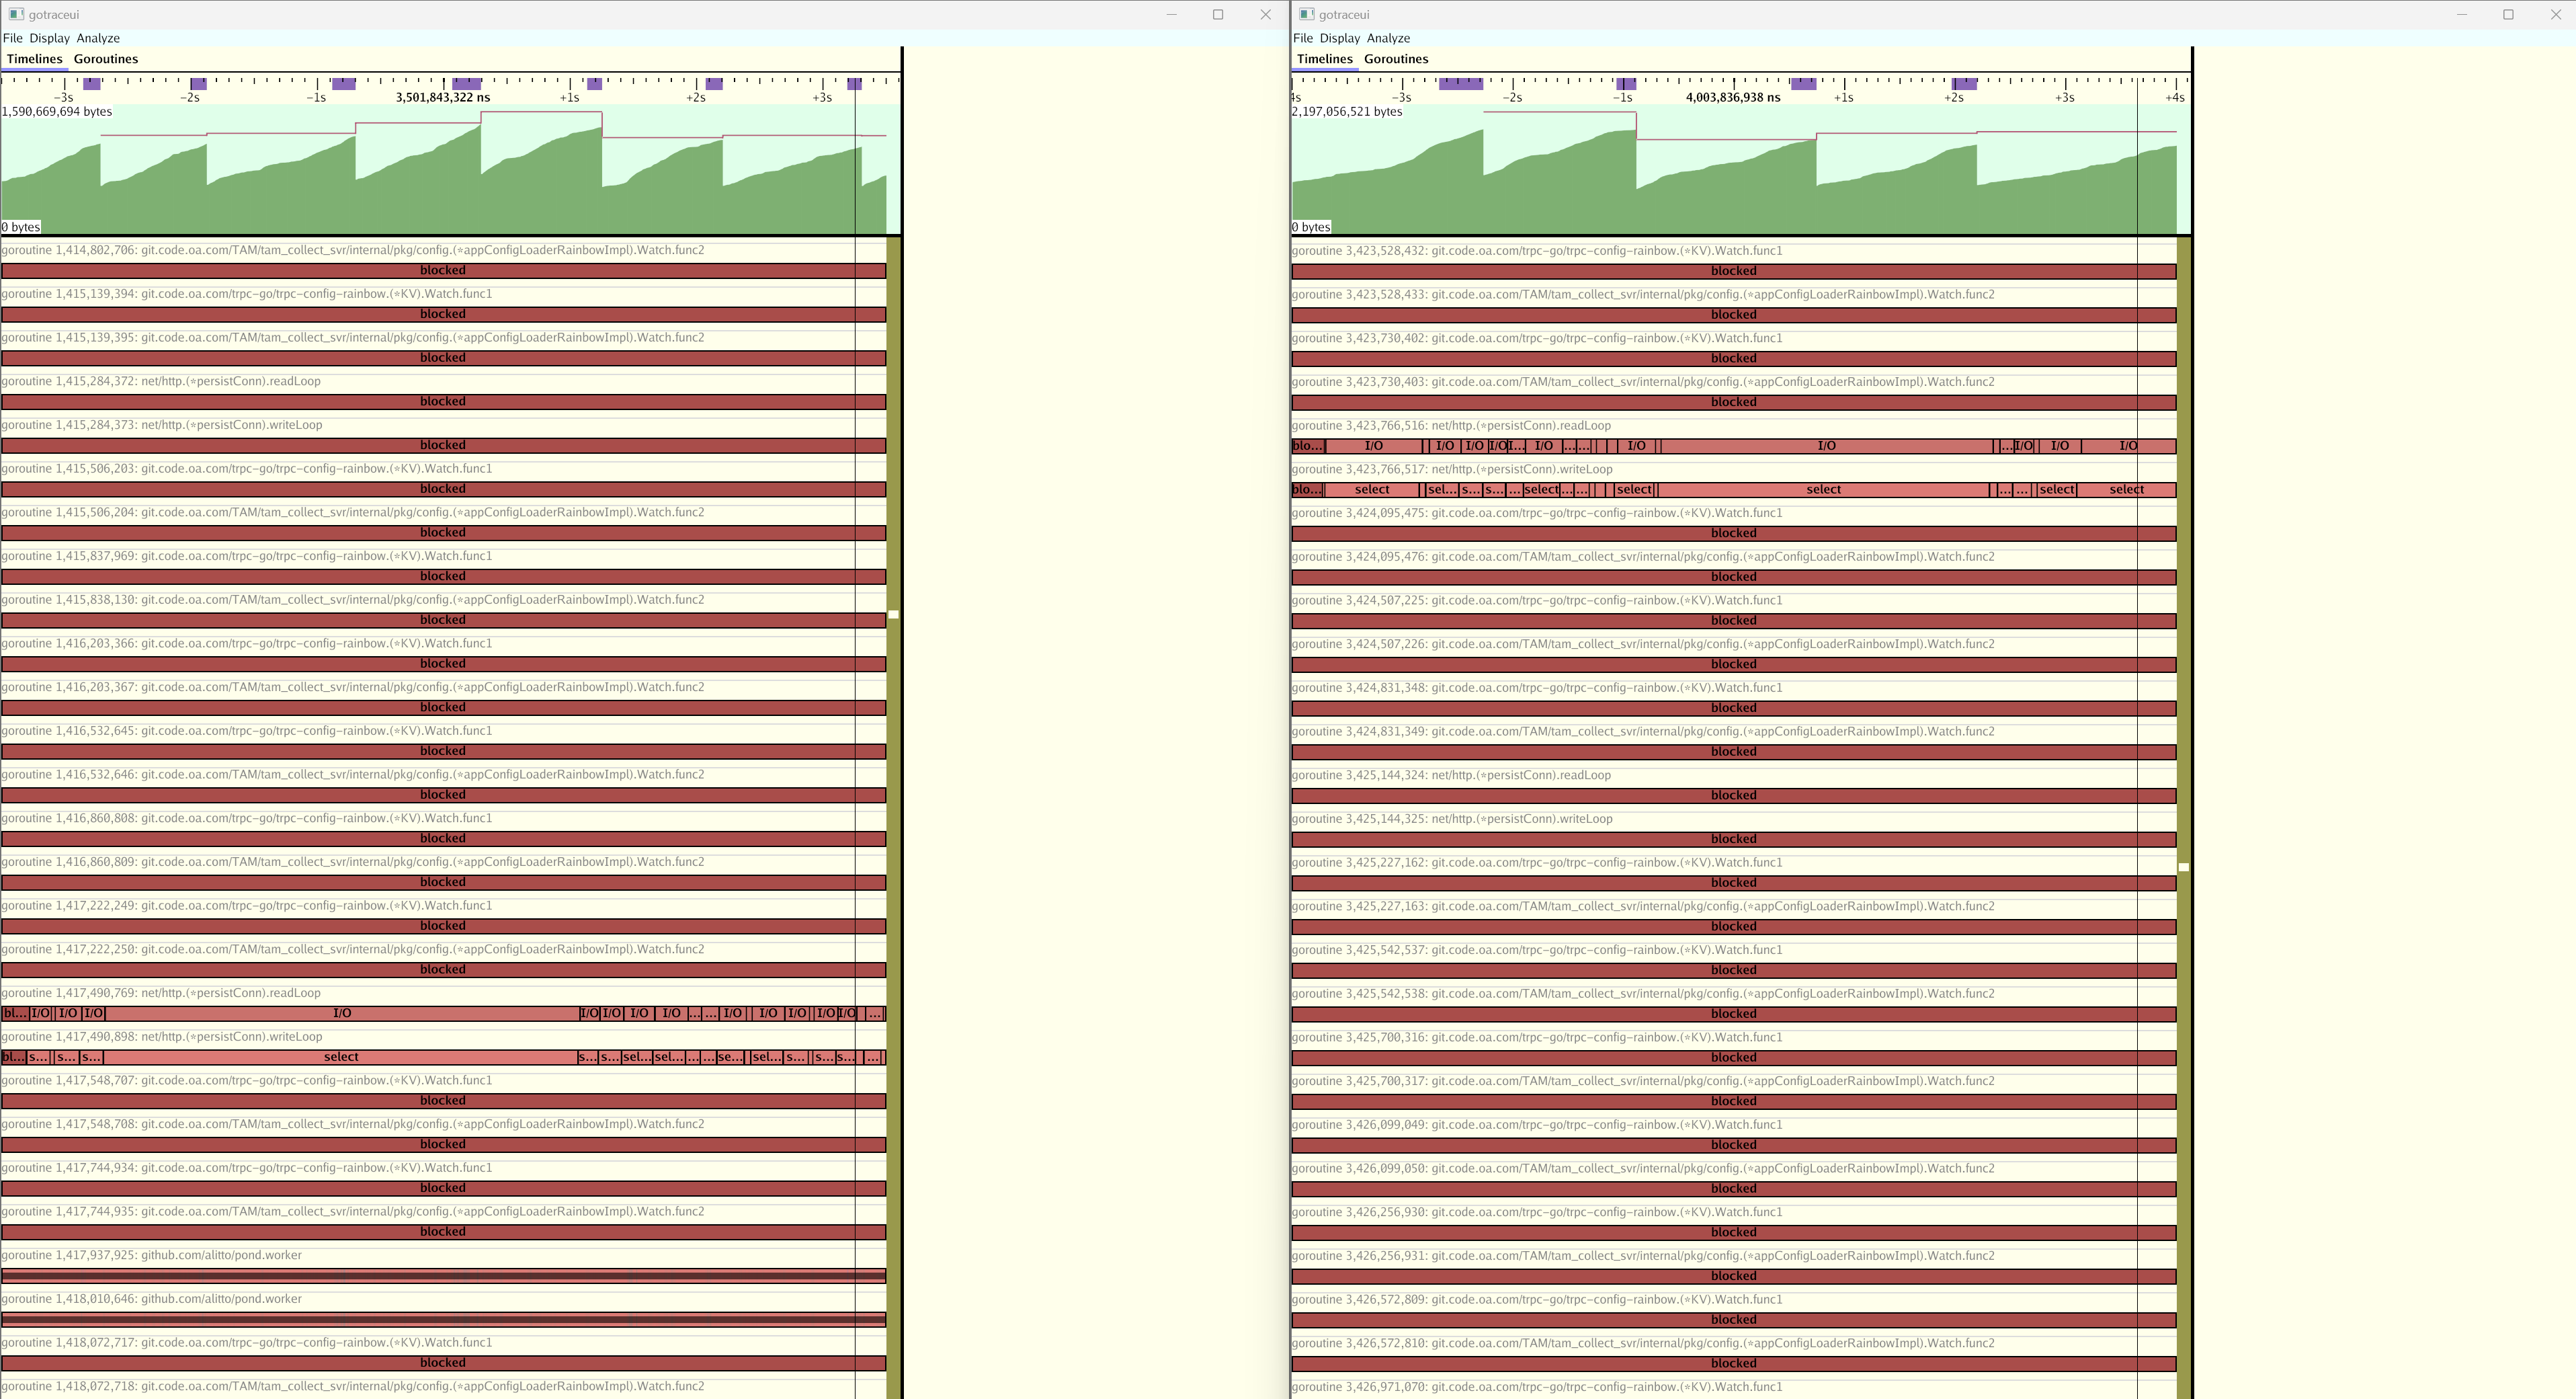
左边是 2025-04-28 抓取的 trace,右边是 2025-05-08 抓取的 trace,从 trace 中可以看到有大量协程在 git.code.oa.com/trpc-go/trpc-config-rainbow.(*KV).Watch.func1 和 internal/pkg/config.(*appConfigLoaderRainbowImpl).Watch.func2 处阻塞,并且数量 巨额增加。
看来问题定位到了,通过阅读代码发现配置模块会定时(1 分钟)启动两个协程用于拉取七彩石配置,由于未知原因代码处于 chan receive 状态卡住。
配置 block 分析后找到对应阻塞堆栈(配置方法见后文):
4670768 124 @ 0x40d172 0x17a39cc 0xcc3d02 0x18eb4f7 0x18eb3e5 0x47cd01
#       0x40d171        runtime.chanrecv1+0x11                                                                                  /data/home/oliverdding/.local/opt/go/current/src/runtime/chan.go:442
#       0x17a39cb       git.code.oa.com/trpc-go/trpc-config-rainbow.(*KV).Watch+0x70b                                           /data/home/oliverdding/Developer/tam_collect_svr/vendor/git.code.oa.com/trpc-go/trpc-config-rainbow/kv_config.go:84
#       0xcc3d01        git.code.oa.com/TAM/tam_collect_svr/internal/pkg/config.(*appConfigLoaderRainbowImpl).Watch+0x221       /data/home/oliverdding/Developer/tam_collect_svr/internal/pkg/config/rainbow.go:61
#       0x18eb4f6       git.code.oa.com/TAM/tam_collect_svr/cmd/interface.loadConfig.func1.2+0xb6                               /data/home/oliverdding/Developer/tam_collect_svr/cmd/interface/config.go:55
#       0x18eb3e4       git.code.oa.com/TAM/tam_collect_svr/cmd/interface.loadConfig.func1+0x1a4                                /data/home/oliverdding/Developer/tam_collect_svr/cmd/interface/config.go:65
找到对应代码,是 trpc-config-rainbow 库中的代码逻辑,查看上下文可以确认 collect 每隔 1 分钟会调用一次 Watch 方法以尝试获取最新配置。
func (k *KV) Watch(ctx context.Context, key string, opts ...config.Option) (<-chan config.Response, error) {
	if err := k.stream.Check(); err != nil {
		return nil, fmt.Errorf("kv watch %s: stream check err: %w", key, err)
	}

	req := &WatchReq{
		key:  key,
		recv: make(chan Response, channelSize),
		done: make(chan struct{}),
	}

	res, err := k.Get(ctx, key, opts...)
	if err != nil {
		return nil, fmt.Errorf("kv watch: get key %s err: %w", key, err)
	}

	req.recv <- Response{
		key:   key,
		value: res.Value(),
		event: config.EventTypePut,
		meta:  res.MetaData(),
	}

	k.stream.AddWatcher(req)
	c := k.watch(key, req.recv)

	<-req.done
	return c, nil
}
req.done 这个 channel 乍一看没人往里放东西,那往上找,req 被传给了 k.stream.AddWatcher(req),这里有可能往 channel 里放东西吗?
func (w *WatchStream) loop() {
	notify := make(chan struct{}, channelSize)
	buf := make([]Response, 0)
	for {
		select {
		case resp := <-w.cbChan:
			buf = append(buf, resp)
			prepareNotify(notify)

		case <-notify:
			buf = notifying(buf, w.outc)

		case req := <-w.submit:
			w.outc = append(w.outc, req.Receive())
			close(req.Done())
			prepareNotify(notify)
		}
	}

}
提交的 req 会被 append 到 outc 数组中,然后关闭 req.done channel,所以这里不会长期阻塞。可是这个 loop 的确有大量阻塞:
733270955104 147 @ 0x4593b7 0x17a9586 0x17a919c 0x47cd01
#	0x4593b6	runtime.selectgo+0x7f6							/data/home/oliverdding/.local/opt/go/current/src/runtime/select.go:508
#	0x17a9585	git.code.oa.com/trpc-go/trpc-config-rainbow.(*WatchStream).loop+0x165	/data/home/oliverdding/Developer/tam_collect_svr/vendor/git.code.oa.com/trpc-go/trpc-config-rainbow/stream.go:106
#	0x17a919b	git.code.oa.com/trpc-go/trpc-config-rainbow.(*WatchStream).Run+0x3b	/data/home/oliverdding/Developer/tam_collect_svr/vendor/git.code.oa.com/trpc-go/trpc-config-rainbow/stream.go:80
继续阅读代码明确 w.cbChan 何时会来数据,最后发现在嵌套的匿名函数作为回调函数,在拉取配置更新成功后会调用并传入当前最新配置文件。而通过 debug 发现该函数是个无限循环,所以明确答案:应只调用一次 Watch 函数作为监控函数获取最新变动,错误使用库导致无限创建监听协程。
排查方式自省
由于历史经验,我一直使用 seconds 参数获取 delta profile 来分析内存泄露,对于泄露急比如泄露数量和请求数量相关的场合,这的确可以发现问题。但对于泄露缓慢,比如按分钟、小时来计的场景,就无法看出来问题了,因为 delta profile 最多就抓取几分钟。
因此在计划分析 pprof 时,应先不加 seconds 参数获取当前状态,再决定是否需要 delta profile 分析变化趋势。这是我因为思维定式导致的工具使用错误。
❯ go tool pprof goroutine.no_time.0.prof
File: collect_svr
Type: goroutine
Time: 2025-05-12 11:36:06 CST
Entering interactive mode (type "help" for commands, "o" for options)
(pprof) top
Showing nodes accounting for 30110, 100% of 30120 total
Dropped 204 nodes (cum <= 150)
      flat  flat%   sum%        cum   cum%
     30110   100%   100%      30110   100%  runtime.gopark
         0     0%   100%      14975 49.72%  git.code.oa.com/TAM/tam_collect_svr/internal/pkg/config.(*appConfigLoaderRainbowImpl).Watch.func1
         0     0%   100%      14975 49.72%  git.code.oa.com/trpc-go/trpc-config-rainbow.(*KV).Watch.func1
         0     0%   100%      29989 99.57%  runtime.chanrecv
         0     0%   100%      29980 99.54%  runtime.chanrecv2

❯ go tool pprof --base goroutine.no_time.0.prof goroutine.no_time.1.prof
File: collect_svr
Type: goroutine
Time: 2025-05-12 11:36:06 CST
Entering interactive mode (type "help" for commands, "o" for options)
(pprof) top
Showing nodes accounting for 35, 39.33% of 89 total
Showing top 10 nodes out of 113
      flat  flat%   sum%        cum   cum%
        41 46.07% 46.07%         41 46.07%  runtime.gopark
        -1  1.12% 44.94%         -1  1.12%  bytes.(*Buffer).WriteString
        -1  1.12% 43.82%         -1  1.12%  go.uber.org/zap.(*Logger).check
        -1  1.12% 42.70%         -1  1.12%  internal/reflectlite.Swapper.func9
        -1  1.12% 41.57%         -1  1.12%  runtime.assertE2I2
        -1  1.12% 40.45%         -1  1.12%  strconv.appendEscapedRune
        -1  1.12% 39.33%         -1  1.12%  syscall.Syscall
         0     0% 39.33%         -8  8.99%  bufio.(*Reader).Peek
         0     0% 39.33%          2  2.25%  bufio.(*Reader).ReadLine
         0     0% 39.33%          2  2.25%  bufio.(*Reader).ReadSlice
此外,通过阅读 pprof 文档,可以有两个更好的排查方式。
debug 参数
debug=N (all profiles): response format: N = 0: binary (default), N > 0: plaintext、
配置 debug 参数会以存文本方式返回当前系统状态,这就可以用于获取汇总信息。
比如 debug=1 就可以获取协程按栈顶函数聚合的分布情况:
❯ curl 'http://localhost:6060/debug/pprof/goroutine?debug=1'
goroutine profile: total 30103
14974 @ 0x43a856 0x4085ec 0x408058 0x96233a 0x46ac81
#       0x962339        git.code.oa.com/TAM/tam_collect_svr/internal/pkg/config.(*appConfigLoaderRainbowImpl).Watch.func1+0x119 /go/src/tam_collect_svr/internal/pkg/config/rainbow.go:72

14974 @ 0x43a856 0x4085ec 0x408058 0xff5ffa 0x46ac81
#       0xff5ff9        git.code.oa.com/trpc-go/trpc-config-rainbow.(*KV).Watch.func1+0xd9      /go/src/tam_collect_svr/vendor/git.code.oa.com/trpc-go/trpc-config-rainbow/kv_config.go:69
就可以看到有 14974 个协程在处理配置更新。
比如 debug=2,可以更详细分析不同协程在什么状态,用如下脚本就可以聚合统计:
❯ curl -s http://localhost:6060/debug/pprof/goroutine?debug=2 | grep -E '^goroutine [0-9]+ \[' | sed -E 's/^goroutine [0-9]+ \[([^]]+)\].*$/\1/' | awk -F',' '{print $1}' | sort | uniq -c | sort -nr
  30044 chan receive
    419 runnable
     46 select
     24 semacquire
     15 IO wait
     12 sleep
      4 sync.Cond.Wait
      2 syscall
      1 running
和代码对上,配置更新的协程都阻塞于 chan receive 状态。
block 分析
通过调用 runtime.SetBlockProfileRate 后可以抓取:
go tool pprof http://localhost:6060/debug/pprof/block
来分析当前阻塞情况,该方法同样能发现处于阻塞状态的协程。
内存泄露排查最佳实践
- 获取当前系统协程状态
- 根据栈顶聚合:
curl 'http://localhost:6060/debug/pprof/goroutine?debug=1' - 根据协程状态聚合:
curl -s http://localhost:6060/debug/pprof/goroutine?debug=2 | grep -E '^goroutine [0-9]+ \[' | sed -E 's/^goroutine [0-9]+ \[([^]]+)\].*$/\1/' | awk -F',' '{print $1}' | sort | uniq -c | sort -nr
- 根据栈顶聚合:
- 分析 heap 变化趋势
- 要么加
seconds参数,直接分析这段时间变化趋势 - 要么抓取两个时间的快照,用
go tool pprof --base对比分析
- 要么加
- 若还需要别的信息
- 加上
curl -o trace.prof 'http://localhost:6060/debug/pprof/trace?seconds=8'分析不同协程运行状态 - 调用
runtime.SetBlockProfileRate后抓取go tool pprof http://localhost:6060/debug/pprof/block获取阻塞状态
- 加上